Understanding urban density: How a bespoke densification model can unlock London’s future growth
– Yorgos Garofalakis, Alexander Alexiou and Daphne Delfaki
Introduction
Our understanding of urban density is rapidly changing. Fuelled by urbanisation, population growth, technology proliferation, changing lifestyles and behaviours and challenged by climate and health crises, cities are seeking new models for future growth. In this future, resilience-driven urban landscape, density has a key role to play. Treated not as an enabler of monolithic high-rises but as a tool for bespoke, balanced and safe placemaking, urban density has the potential to future-proof neighbourhoods, districts and cities.
A brief history of London’s density
Pandemics, alongside a range of socio-economic and environmental phenomena, have played a significant role in defining the way modern cities are shaped, morphed and adapted. In 1832, the cholera epidemic made its way from Asia to Europe reaching London in a matter of weeks and thus signifying the beginning of a century of multiple cholera outbreaks.
These outbreaks didn’t only cost the lives of millions of people globally but they also transformed cities from crowded, unplanned places—perfect breeding grounds for viruses—to places with wider streets, sanitation and waste management systems and open green spaces.
The main theory at the time, this of the miasma, a toxic vapor that travels through the air, had a significant impact on the built environment and the way cities, their spaces and their infrastructure were organised. The installation of underground wastewater systems allowed streets to become straighter, wider and paved and consequently led to the expansion of housing and industry uses to parts of the city that until then were inaccessible1.
-
“The idea that this sort of stench is coming into the house, seeping through the house and possibly bringing in diseases like cholera or typhoid… is actually one of the great driving forces of sanitary reform in the 19th century.”
Lee Jackson, ‘Dirty Old London’: A History Of The Victorians’ Infamous Filth
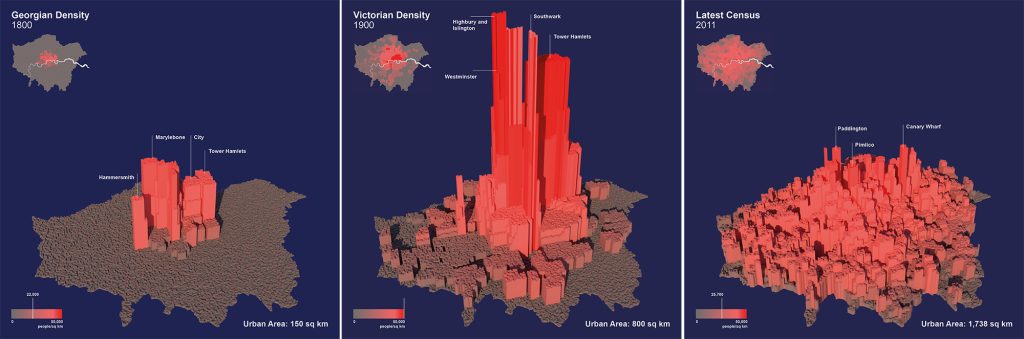
The transition of London from the Georgian to the Victorian era saw a significant increase in the city’s urban area and at the same of its population density. The city’s urban area grew from 150 km2 to 800 km2 and the population density more than doubled, from 22,000 people/km2 to 50,000 people/km2. During this transition, urban density played a catalytic role in the spread of diseases. The denser areas of Victorian London such as the East End saw a steep increase in infectious diseases, resulting in high child mortality rate (20%) and short life expectancy (close to 19 years compared to 37 which was the average life expectancy in the rest of the city)2.
As London’s urbanisation rate increased so did the proliferation of technology. This allowed London to improve its sanitary infrastructure system which gradually became more complex and elaborate. At the same time, the introduction of motorised transport, the development of the city’s railway system and the rise in prices of urban land in the centre of the city, saw an acceleration in the development of the city’s suburbs. For the first time, an increasing number of people would move outside the city’s centre and return to it for work and access to commercial and leisure services, activities and spaces. This urban sprawl phenomenon was underpinned by an increasing class divide; a growing middle class would move to the suburbs of the city leaving the poor to inhabit the inner-city areas3.
The completion of large-scale engineering projects such as the Thames Tunnel, the Thames Embankment, the expansion of the road network and the introduction of bridges that connected the north with the south part of the city shaped the urban landscape and choreography of London as we know it today, while playing a major role in expanding the urban area from 800 km2 at the beginning of the 20th century to 1,738 km2 in 2011. It is important to highlight that during the same period, the population density returned to Georgian era levels (25,700 people/km2)4.
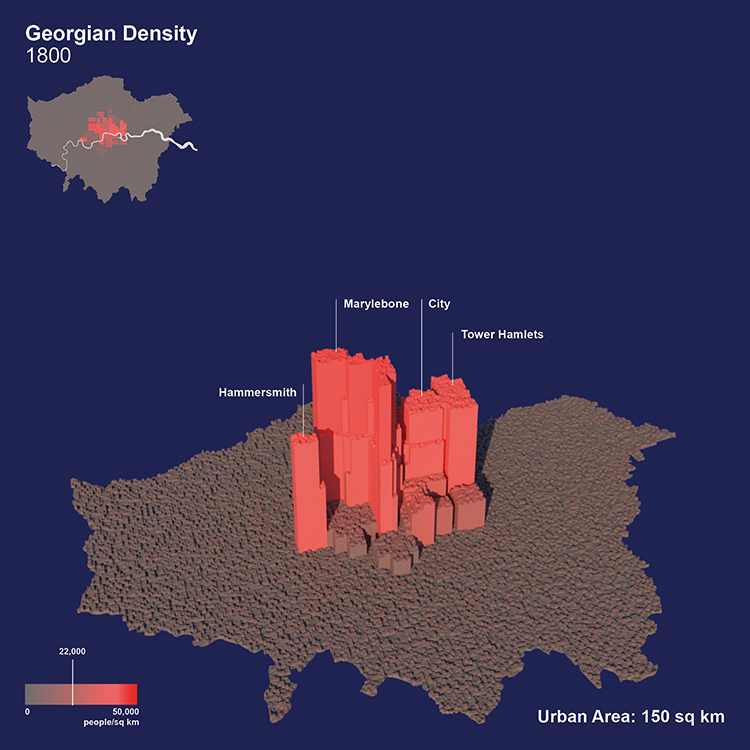
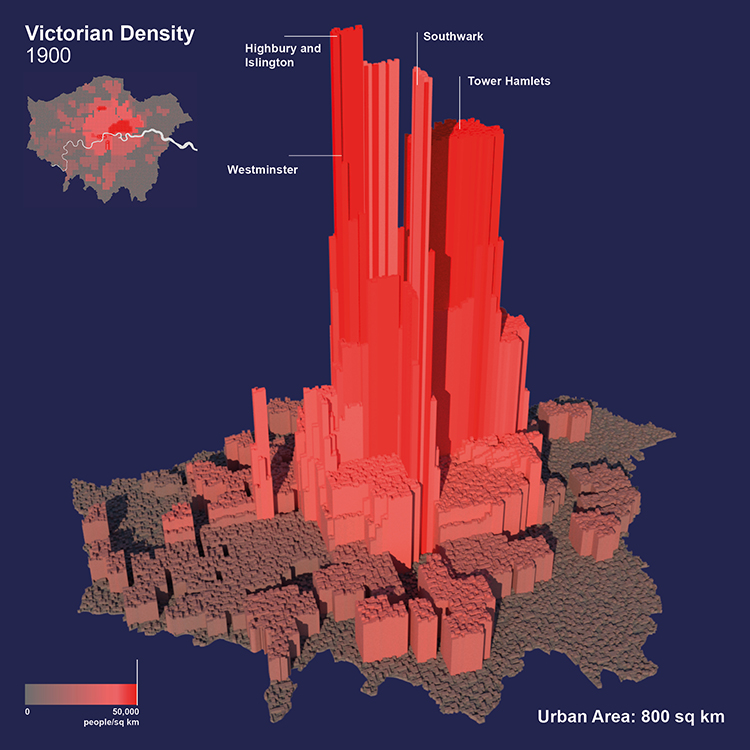
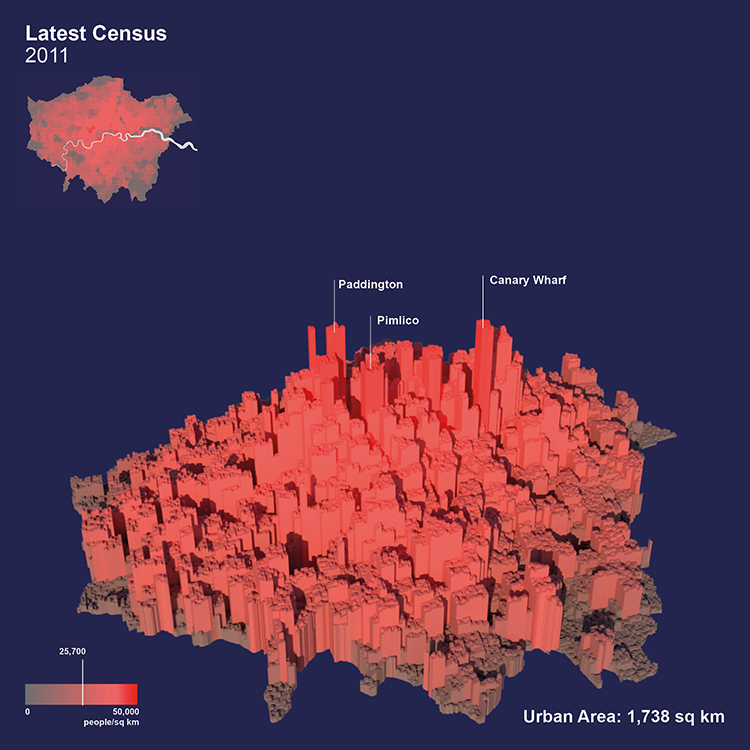
1., 2. and 3.: Population density of London during the Georgian era (1734 – c. 1830), Victorian era (1837 -1901) and today. Source: Authors’ own.
Density and COVID-19
The recent outbreak of COVID-19 brought the discussion about urban density to the fore. This ongoing discourse often puts places of high density under scrutiny, framing them as areas of higher risk or even sources of the outbreak. Although this approach could, under specific circumstances, prove true, it is important to highlight the difference between treating density as a ratio of people per area unit and as part of a dynamic system that includes demographic, socio-economic and physical factors5.
Dense city areas can be more resilient and can recover faster during and after an outbreak. The provision of abundant and affordable housing is more obtainable in a dense urban environment, as is more equal access to opportunity. These elements can ensure that key workers, who are often low paid, can cover their housing needs without moving further away from central, urban districts. They can also positively affect the issue of homelessness, which becomes additionally problematic during a global health crisis6.
During a viral outbreak, like COVID-19, ensuring that city spaces, systems and infrastructure are still able to accommodate key operations and functions is paramount; for example, ensuring that key workers can still arrive at their workplace in a safe, risk-free and smooth manner. Moving between the home and the workplace becomes easier in a dense urban environment, as more housing is available and people can afford to live closer to their workplace. Social distancing can be achieved more easily, as people can travel by bike or on foot. In this case, proximity to open spaces and no-car networks are important, as they facilitate low-risk transportation and they ensure access to outdoor, public spaces for exercise and recreation. As these factors directly affect the density index of an urban district, it becomes apparent that there is no clear direction on the optimal density levels for a resilient urban unit, in times of a pandemic7.
Towards a gradient for city density
There is a great difference between physical density and perceived density. In other words, it is not the density in itself that is sought after, but rather the quality that the dense urban environment provides, in the form of proximity to work, cultural offerings, activities, parks, and so on8.
If cities have taught us something about density is that we need to create it the right way; dense places should have ample in-between space for the creation of good living environments. Many cities have developed in an outward fashion, depending on cars and taking of natural land to do so. Densification allows for shorter travel times and good public transportation systems, therefore promoting a sustainable development system.
The challenges that come with densification are linked to the provision of amenities for the residents of a city, the disappearance of open spaces, the lack of natural light, the shrinking of residential courtyards, the lack of schools and the obstructed view corridors. Often, densification projects lead to exacerbated land prices and consequently to gentrification and social inequality.
It seems rather unlikely that the requirements of density will be reduced for the city of London. The population will keep increasing (surpassing the 10-million mark by 2036) with the needs for housing following along. However, the way density is achieved in a metropolis like London should be re-examined to facilitate viable solutions that enhance the urban fabric and protect us from future outbreaks.
Governments around the world have already started to make changes to their design policies due to COVID-19. In May 2020, the UK Department for Transport (DfT) published the “Traffic Management Act 2004: network management in response to COVID-19” highlighting the value of active travel and promoting the reallocation of road spaces to expand cycle lanes, widen footways and encourage walking and cycling9.
A future-proof approach to density should not be a binary one. It’s not about either the creation of a Shanghai-like London cityscape or clinging to the detached British houses and moving to the suburbs. Introducing a system of gradience when it comes to density can result in the densification of both the inner, urban part of London, but also its outskirts as well as sensitive areas such as the Green Belt and Conservation Areas in a uniform, controlled manner, enabled by a range of typologies for in-between spaces.
We are exploring this gradience system through the development of an interactive GIS tool that will allow for the identification of areas that are suitable for densification. The underlying logic stems from the idea of a gradient system which assigns values in different areas based on the overlapping layers. This allows the user to define the suitability of each layer creating a flexible, non-rigid system.
In this first draft, we explore the system as a visual tool that allows for the identification of spatial patterns.
Elements that are factored in include:
- Average income
- Number of residents per household/building
- Type of housing (detached, semi-detached houses with gardens versus flats—linked to ‘quality of life’ during lockdown situations)
- Proximity to healthcare provision (hospitals and community healthcare facilities)
- Access to open spaces
- No-car network (cycling paths, pedestrian zones, low-traffic neighbourhoods)
- Rail network and proximity to rail stations
- The Green Belt
- Existing urbanised areas
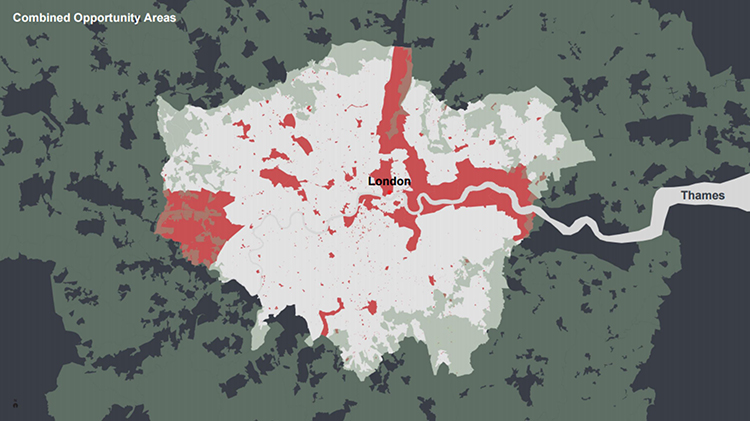
4. Includes the combined identified opportunity areas for development in London in red and the Green Belt and conservation areas in green. Source: Authors’ own.
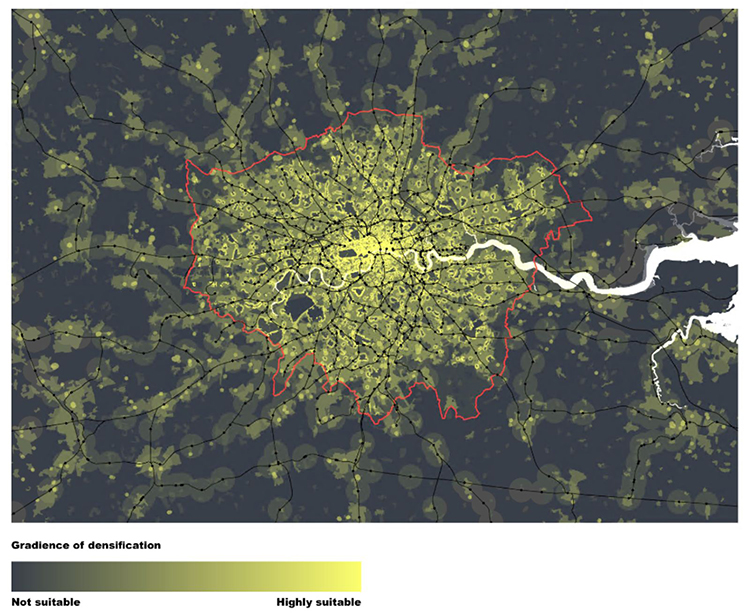
5. A gradient of densification – a visual tool. Source: Authors’ own.
The model runs with hypotheses based on the theoretical analysis of the previous section. It also utilises the parameters mentioned in the aforementioned list and it defines which areas are suitable for densification by overlaying the available data or by generating a ratio of two parameters at the time.
In order to explain further the potential of this synergy between theoretical assumptions, data and visualisation, this final section will briefly present an example of how this visual tool works and identifies spatial patterns.
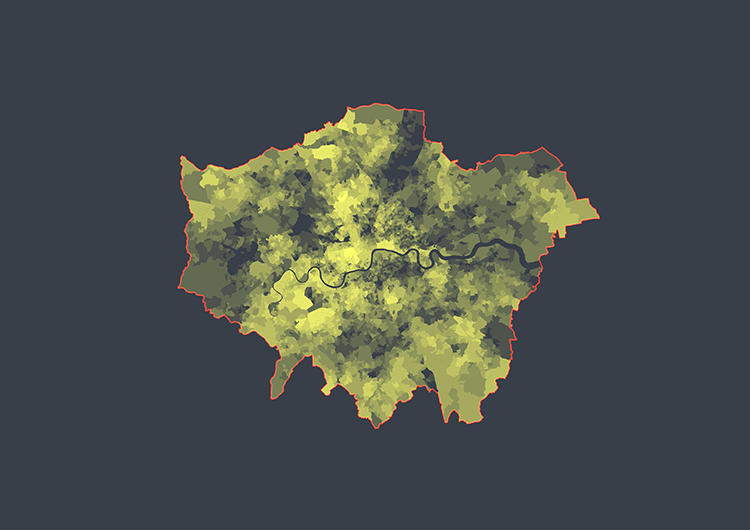
The following example is based on the hypothesis that high density can positively contribute to how resilient an area is in case of a public health crisis. Dense environments, if properly planned, can offer more affordable housing opportunities. As expected, areas with existing high population density are not deemed suitable for further densification. However, the average income is also a factor that plays a key role in the hypothesis, as areas with high population density and low income are the least suitable for densification (since density in this case becomes a disadvantage; limited access to public spaces, healthcare facilities etc). By creating a visual representation of the population density10/average income ratio we create a gradient that showcases which areas are most suitable for densification.
6. Income. Source: Authors’ own.
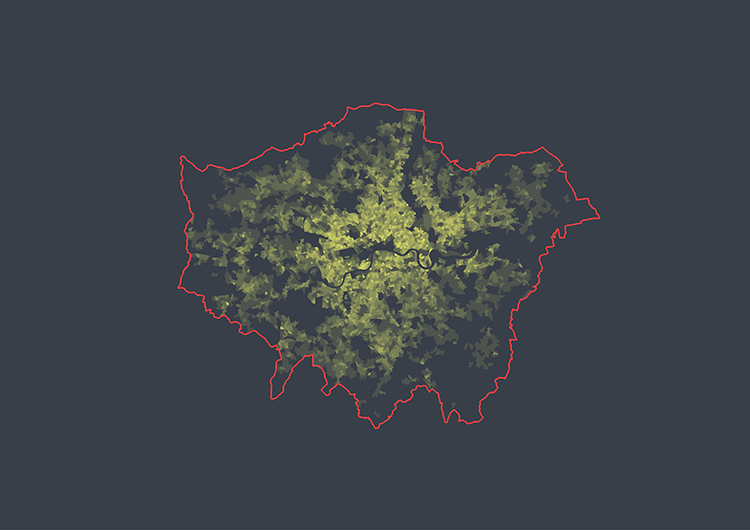
7. Density. Source: Authors’ own.
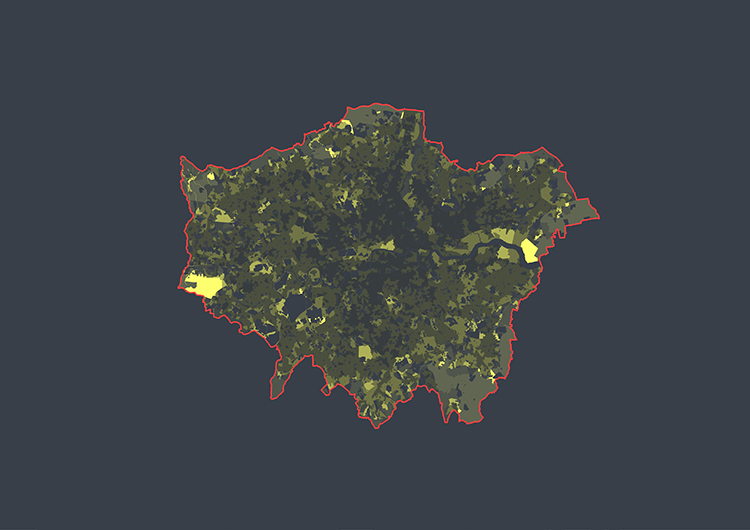
8. Population density/average income ratio. Source: Authors’ own.
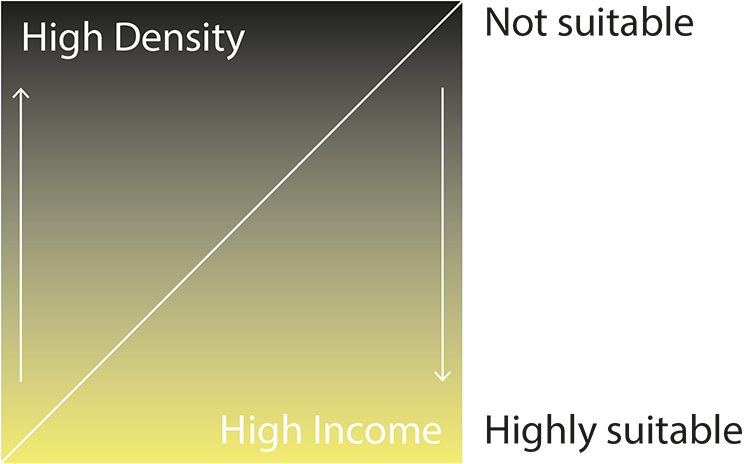
9. Legend. Source: Authors’ own.
Notes
1. Klein, C. (2020) How pandemics spurred cities to make more green space for people. [online] History. Available at: https://www.history.com/news/cholera-pandemic-new-york-city-london-paris-green-space. [Accessed 14 May 2020].
2. Kook, B., & Werner, A. (2017) Breathing in London’s history: from the Great Stink to the Great Smog. [online] Museum of London. Available at: https://www.museumoflondon.org.uk/discover/londons-past-air. [Accessed 14 May 2020].
3. Robinson, B. (2011). London: ‘A modern Babylon’. [online] BBC – British History. Available at:
http://www.bbc.co.uk/history/british/victorians/london_modern_babylon_01.shtml. [Accessed 14 May 2020].
4. ‘Albert Embankment’, in Survey of London: Volume 23, Lambeth: South Bank and Vauxhall, ed. Howard Roberts and Walter H Godfrey (London, 1951), pp. 148-149. [online] British History Online. Available at: http://www.british-history.ac.uk/survey-london/vol23/pp148-149 [Accessed 14 May 2020].
5. Florida, R. (2020). The geography of coronavirus. [online] CityLab. Available at: https://www.citylab.com/equity/2020/04/coronavirus-spread-map-city-urban-density-suburbs-rural-data/609394/. [Accessed 14 May 2020].
6. Fang, W. & Wahba, S. (2020). Urban density is not an enemy in the coronavirus fight: Evidence from China. [online] World Bank. Available at: https://blogs.worldbank.org/sustainablecities/urban-density-not-enemy-coronavirus-fight-evidence-china. [Accessed 14 May 2020].
7. Galante, C. (2020). Now is the time to embrace density. [online] The New York Times. Available at: https://www.nytimes.com/2020/05/12/opinion/urban-density-inequality-coronavirus.html. [Accessed 14 May 2020].
8. Boverket. The Swedish National Board of Housing, Building and Planning (2017). [online] Urban Density Done Right.Ideas on densification of cities and other communities. Available at: https://www.boverket.se/globalassets/publikationer/dokument/2017/urban-density-done-right.pdf. [Accessed 14 May 2020].
9. Department for Transport (UK). Traffic Management Act 2004: network management in response to COVID-19 . [online] GOV.UK. Available at: https://www.gov.uk/government/publications/reallocating-road-space-in-response-to-covid-19-statutory-guidance-for-local-authorities/traffic-management-act-2004-network-management-in-response-to-covid-19. [Accessed 14 May 2020].
10. The population density in this example (people/km2) was calculated in each Lower Layer Super Output Area (LSOA) without the area of green spaces or the Green Belt.
George Garofalakis is an urban planner and GIS analyst based in Luxembourg. He studied Urban Planning and Regional Development in the University of Thessaly in Greece and Urban Design in University College London’s Bartlett School of Architecture. Yorgos’ work focuses on spatial data analysis and visualisation using GIS. His work with leading UK planning and design organisations has been pivotal in the successful delivery of a variety of projects, ranging from neighbourhood-scale character studies to large-scale masterplans. His cartographic analysis of London’s Local Character and Density, a project commissioned by Historic England and delivered by Allies and Morrison’s Urban Practitioners, won the 2017 RIBA President’s Award for Research in the Cities and Community category. In 2017, Yorgos co-founded SpaceViz, a data visualisation studio operating at the intersection of data, technology and design.
Alexander Alexiou is an urban planner based in London. He studied Urban Planning and Regional Development in the University of Thessaly in Greece. Since 2019, Alexander is working as a Foresight Strategist with global design and engineering firm Arup analysing the trends that are shaping the future of the built environment and developing scenarios and tools that allow public and private organisations to understand change and empower them to make better decisions about the future. Prior to Arup, he worked as a Design Strategist for design and architecture firm Gensler and as a Business Development Strategist for engineering firm Buro Happold. In 2017, Alexander co-founded SpaceViz, a data visualisation studio operating at the intersection of data, technology and design.Daphne Delfaki is an urban planner and researcher based in London and Athens. She studied Urban Planning and Regional Development in the University of Thessaly in Greece and completed a Master’s degree in Mobility, Migration and Development in the School of Oriental and African Studies (SOAS) in London. Through her research work, Daphne examines the impact of social and cultural sensitivity on placemaking and explores the relationship between migration and the production of space in urban environments. Recently, Daphne worked with the Urban Design team of Perkins+Will to develop a GIS tool able to identify areas for future development of knowledge economy focused projects in the South East of England.
Volume 3, No. 2 June 2020